Growth leaders at mid-market DTC brands are staring at a structural breakdown in the channel economics they built their playbooks on. The question isn't whether the model is broken. The question is what replaces it — and whether you move first or get moved on.
CASE STUDY | Research & Experience · Composite Brand Profile The Brand That Made Us Build This Mid-Market Shopify Plus · $18M GMV · Fashion & Lifestyle · ~120K Monthly Visitors In late 2022, we started working closely with a growing Shopify Plus brand — a fashion and lifestyle company generating around $18M in annual GMV with roughly 120,000 unique visitors per month. By any surface measure, the business was healthy. YoY revenue was up. The team was sharp. Their Klaviyo setup was one of the most thoughtfully built we'd seen at that revenue tier. But the Head of eCommerce was frustrated in a way she couldn't fully articulate. She showed us the number that was bothering her: a 2.2% conversion rate that hadn't moved in 14 months, despite significant investment in new ad creative, a site redesign, and an A/B testing programme that ran continuously. CAC had crept from $28 to $43 over the same period. ROAS on their primary Meta campaigns sat at 1.8x — down from 3.9x eighteen months prior.
When we pulled the session data, the picture sharpened. Of their 120,000 monthly visitors, 91% — over 109,000 people — were leaving without providing an email address or making a purchase. Their Klaviyo flows reached only the 9% they already knew. The other 91% were completely invisible: no identity, no history, no re-engagement possible. They'd paid $43 each to acquire them and had no way of reaching them again. This brand wasn't underperforming because of weak creative or poor product-market fit. They were underperforming because their entire growth architecture was built for known customers — and the vast majority of their traffic didn't qualify. The anonymous visitor problem wasn't a tactical gap. It was a structural ceiling. ⓘ The brand profile above is a composite drawn from Convertive's research and direct work with mid-market Shopify Plus merchants. Specific company names and identifying details have been generalised to protect confidentiality. |
This isn't a piece about tactics. It's about the structural forces reshaping e-commerce growth economics and the strategic implications for anyone running a Shopify Plus brand at scale. The data is pointing somewhere specific. Let's follow it.
Signal Collapse: The Three-Year Arc
In 2021, the DTC playbook looked relatively straightforward. Spend on Meta and Google, drop a pixel, follow users around the internet, recover abandoners via retargeting, and layer Klaviyo flows on top for the email list. The model worked. CAC was manageable. ROAS was north of 4x for most brands running disciplined campaigns.
Then three structural shifts hit in quick succession — each one independently damaging, together systemically corrosive.
Shift 1: iOS 14 and the Pixel Problem
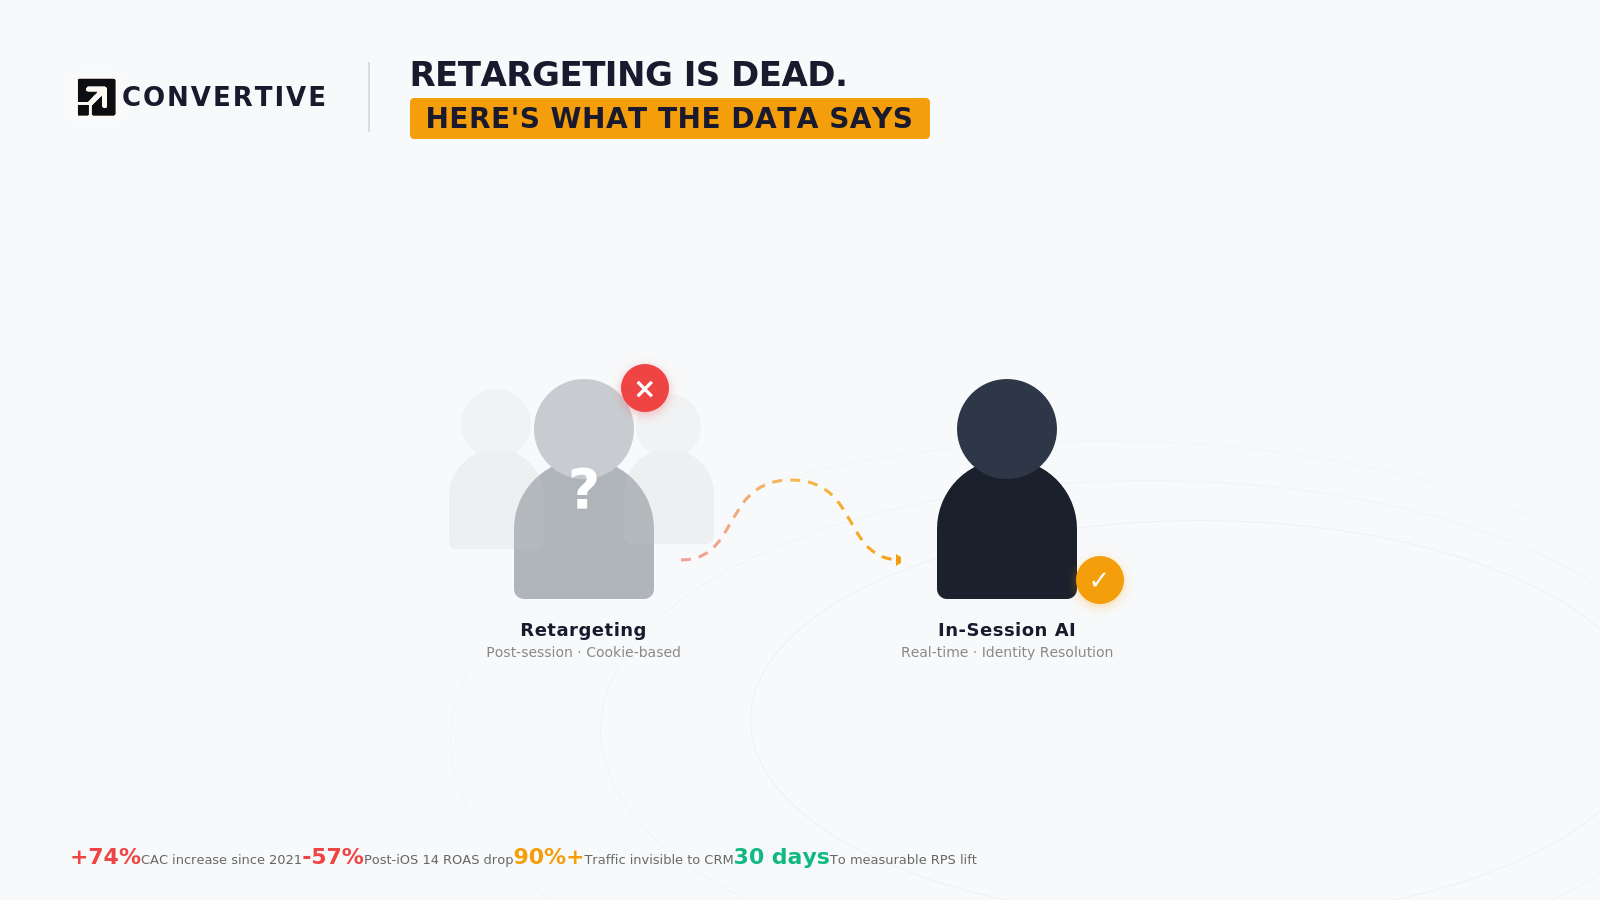
When Apple's App Tracking Transparency framework rolled out, it didn't just reduce Meta's signal quality — it restructured the signal asymmetry that had made social retargeting viable. Reported ROAS on Meta campaigns dropped between 30–57% across benchmark cohorts. Attribution became unreliable. Lookalike audiences lost their fidelity. The pixel, the cornerstone of retargeting strategy for a decade, became a blunt instrument almost overnight.
−57% Average reported ROAS drop on Meta campaigns post-iOS 14 ATT rollout Per Shopify's internal advertiser benchmarks and third-party attribution providers. Average dropped from 3.9× to 1.8× across DTC benchmark cohorts. |
Brands doubled their spend trying to compensate. Some moved budget to TikTok, where signal quality was briefly strong but attribution never caught up. Others leaned into Google Performance Max, which showed volume but delivered opacity. The acquisition cost kept climbing regardless of which channel mix was tried.
Shift 2: Cookie Deprecation and the Identity Gap
Third-party cookies — the tracking mechanism underlying display retargeting, cross-site behavioral profiling, and much of programmatic advertising — have now been phased out across the major browser ecosystem. The consequence: post-session re-engagement via behavioral retargeting now requires first-party data you may not have. For most brands, that data exists only for the known 10–25% of traffic who previously provided an email or logged into an account. Everyone else is a ghost.
Shift 3: The Rising Floor of Acquisition Costs
The combination of reduced signal quality and increased platform competition produced a compounding CAC problem. More brands shifted to performance marketing as physical retail became harder; auction dynamics became more competitive; CPMs rose. Industry benchmarks show a 74% increase in average DTC acquisition costs between 2021 and 2025. This isn't cyclical — it's structural. There is no platform correction coming that reverses the signal degradation.
BY THE NUMBERS — THE DTC ACQUISITION CRISIS, 2025
+74% CAC increase vs. 2021 benchmark, DTC brands on Meta/Google | 90%+ Share of traffic that exits without identity resolution or purchase | 2.1% Industry median conversion rate — flat for 3 consecutive years | 90s The average high-intent session window before a visitor exits |
The Asymmetry Nobody Is Talking About
Here is the number that should be on every growth leader's dashboard but rarely is: your acquisition spend is generating sessions, not customers. The median DTC brand converting at 2.1% is, by definition, failing to monetize 97.9% of the traffic it paid to acquire. At $40 average CAC, a brand doing 100,000 monthly visitors is spending $4M per year on acquisition and converting approximately 2,100 of those sessions into revenue events.
"The funnel isn't leaking at the bottom. It's been structurally open at the top for years. We just had cheap enough acquisition costs to ignore it."
This asymmetry has always existed. What changed is the cost structure. When CAC was $12, a 2% conversion rate was suboptimal but survivable. At $40, it becomes a strategic crisis. The math changes the priority ranking of the problem entirely.
What makes this particularly acute for heads of growth is the silence of the failure. A leaking pipeline is visible. A flat conversion rate generates a board conversation. But anonymous traffic waste generates no alarm. The analytics dashboard shows visitors, sessions, and bounce rates — but it doesn't translate those numbers into the real figure: "we spent $38,000 this month on visitors who left without a trace."
Where the Leverage Actually Lives
If post-session re-engagement is degrading and acquisition efficiency is declining, where does margin-accretive growth come from? The answer the data points toward is in-session conversion rate optimization — but not the A/B testing, landing page iteration kind. The kind that operates at the behavioral layer, in real time, during the session itself.
Consider the signal density in a typical shopping session:
• Category affinity declares itself within the first 2–3 clicks. A visitor who opens women's outerwear, filters by "under $150," and checks the sale section has communicated price sensitivity and gender preference without a single form fill.
• Conversion readiness correlates with specific micro-behaviors: reading the size guide (strong buying signal), checking return policy (risk-mitigation phase), repeated product detail page visits (comparison narrowing). These follow identifiable sequences.
• Abandonment risk is detectable before exit. Dwell time decay, cursor movement toward the browser bar, and rapid tab-switching behavior are all measurable proxies for disengagement onset.
• Session depth — the number of prior sessions from the same device — is a strong predictor of purchase likelihood, but only if cross-session behavioral history is preserved in a persistent anonymous profile, not wiped at session end.
The data exists in every session. The problem is that virtually no mid-market brand has an architecture that can act on it in real time. Most martech stacks are built for post-hoc segmentation on known customers. The analytical capability exists; the activation capability does not.
The Structural Shift: Channel-Led to Session-Led Growth
The emerging pattern among brands outperforming on conversion efficiency in 2025 is a reorientation of growth architecture — from channel-led models (spend more to acquire more, re-engage via retargeting) to session-led models (extract maximum value from every session, regardless of whether you know who the visitor is).
Growth Lever | 2021 Status | 2025 Status | Trajectory |
Meta / Social Retargeting | Primary growth driver | Diminishing returns, low attribution confidence | Declining |
Third-Party Cookie Retargeting | Core display / programmatic layer | Deprecated across major browsers | Defunct |
Email / SMS (Known Visitors) | Secondary recovery channel | Effective but limited to ~20% of traffic | Stable |
On-Site A/B Testing | Conversion rate lift lever | Marginal gains, slow iteration cycles | Plateauing |
In-Session AI Personalization | Nascent, enterprise-only | Accessible to mid-market; measurable lift in 30 days | Accelerating |
First-Party Data Infrastructure | Nice-to-have | Strategic necessity; foundation for every other lever | Critical |
Evaluating Session-Led Growth: A Framework
For growth leaders assessing whether to invest in in-session intelligence, the evaluation criteria should be structured around four questions:
01 / Identity Layer Does it build anonymous profiles as a first-class data object? Not just device fingerprinting. A persistent behavioral model per anonymous visitor — session count, intent signals, price sensitivity, category affinity — stored and updated in real time. | 02 / Signal Accuracy What is the visitor identification accuracy? Below 95% accuracy, anonymous profiles are too noisy for activation. A dataset where 1 in 7 profiles is a duplicate or misidentified produces misleading behavioral signals at scale. |
03 / Stack Integration Does it feed your existing stack or replace it? The right in-session layer enhances Klaviyo, GA4, and Attentive — it doesn't require displacing them. Behavioral intelligence should flow downstream into your existing activation channels. | 04 / Time to Signal How quickly does it produce measurable revenue lift? If the answer is "evaluate after 90 days," the system is learning too slowly. In-session AI should produce measurable Revenue per Session improvement within 30 days of deployment. |
The Strategic Implication
The growth leaders who will outperform over the next three years are not the ones who find a way to make post-session retargeting work again. That structural shift isn't reversible. They are the ones who correctly diagnose that the session is now the primary value-capture window — and build the architecture to exploit it before their competitors do.
Mid-market DTC brands with 50,000–500,000 monthly visitors are sitting on enormous behavioral signal density every single day. The problem is that signal evaporates at session end. Every visitor who closes the tab takes their intent data with them, permanently, unless an in-session architecture captured and acted on it in real time.
The brands reorienting around this reality are beginning to talk about Revenue per Session as the primary growth metric — not conversion rate, not ROAS, not CAC in isolation. RPS asks the right question: given everything we know about this visitor, in this session, right now, how much revenue did we generate? It unifies acquisition efficiency and on-site performance into a single number that reflects the actual health of the growth engine.
The data isn't ambiguous. CAC is structurally elevated. Third-party signals are gone. Post-session re-engagement is degrading. The window is the session. The only question for every head of e-commerce right now is whether they have an architecture that can act inside it.